RSI, MACD, and Moving Averages: What They Actually Mean and How to Stop Using Them Wrong
By Bitara Academy · June 2026 · 13 min read
The Chart That Looks Like a Fighter Jet Cockpit
You added RSI. Then MACD. Maybe Bollinger Bands. A couple of moving averages. Perhaps Stochastic and Volume Profile. Before long, your chart is covered in coloured lines, histograms, and oscillators — and somehow, you are still losing money.
Meanwhile, the professional trader on the other side of your trade is looking at a clean chart with two or three tools, making high-probability decisions with clarity and speed.
This is the indicator paradox: more indicators feel like more information, but they actually produce more confusion, more contradictory signals, and worse outcomes. The traders who consistently profit from technical analysis are not the ones using the most sophisticated tools. They are the ones who deeply understand a small number of tools and use them correctly.
This guide covers the three most searched, most used, and most misused indicators in crypto — RSI, MACD, and Moving Averages — with the depth required to actually use them well. Not as fortune tellers. As decision frameworks.
The Fundamental Misconception About Indicators
Before covering each indicator individually, the single most important thing to understand:
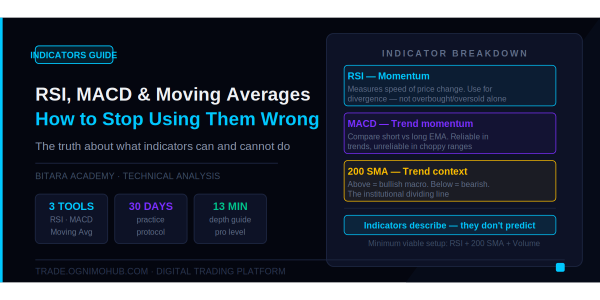
Indicators do not predict the future. They describe the present.
RSI is not telling you the price will fall. It is telling you that recent upward momentum has been unusually strong relative to history. MACD is not telling you to buy. It is telling you that short-term momentum has shifted relative to longer-term momentum. A moving average is not a magic support level. It is the mathematical average of past prices — useful context, not prophecy.
The moment you stop expecting indicators to tell you what will happen, and start using them to understand what is happening, they become enormously more useful.
Indicators are not predictive magic tools. They are decision frameworks. Most traders fail because they expect indicators to tell them what will happen, instead of helping them understand what is happening. That distinction changes everything.
With that foundation established, here is how each indicator works and how to use it correctly.
Part 1: RSI — The Relative Strength Index
What It Actually Measures
RSI measures the speed and magnitude of recent price changes. Specifically, it calculates the ratio of average gains to average losses over a specified lookback period (standard is 14 periods) and normalises the result to a scale of 0 to 100.
A high RSI value means recent gains have been significantly larger than recent losses — the asset has been moving up strongly. A low RSI value means recent losses have significantly outpaced gains — the asset has been declining strongly.
RSI helps traders spot when a crypto asset is potentially overbought (too expensive) or oversold (undervalued). If Bitcoin's RSI hits 80, it might signal a short-term pullback.
The Standard — and Misused — Interpretation
Above 70 = overbought. Below 30 = oversold.
Most traders learn this and immediately start selling every time RSI crosses 70 and buying every time it crosses 30. This approach fails regularly and for a specific reason: in a strong trending market, RSI can stay in overbought territory for the entire duration of the trend.
During Bitcoin's rally from $30,000 to $69,000 in 2021, RSI was above 70 for extended periods. Every trader who sold when RSI crossed 70 left the majority of that move on the table. The "overbought" reading was technically accurate — momentum was strong — but it was not a sell signal in the context of that trend.
The correct reading of overbought and oversold:
In a ranging market: overbought and oversold readings are reliable mean-reversion signals. Price oscillates between levels without sustained directional bias. RSI above 70 suggests the current range high is near. RSI below 30 suggests the current range low is near.
In a trending market: overbought and oversold readings are trend strength signals, not reversal signals. In an uptrend, RSI staying above 50 — and periodically touching 70+ — is confirmation that the trend is healthy. It should not trigger selling.
Context is everything. The same RSI reading means different things in different market conditions.
The High-Value RSI Signal: Divergence
Divergence is where RSI delivers its most reliable and most actionable information.
Bearish divergence: Price makes a new higher high, but RSI makes a lower high on that same move. Price is reaching new highs, but the momentum behind those highs is weakening. This is a warning signal — not a guaranteed reversal, but evidence that the buyers driving the trend are losing conviction.
Bullish divergence: Price makes a new lower low, but RSI makes a higher low on that same move. Price is still falling, but the sellers driving it are losing momentum. This often precedes a trend reversal or at minimum a significant bounce.
Divergence signals are most reliable on the 4-hour and daily charts. On lower timeframes, the noise-to-signal ratio makes divergences less dependable.
Choose one trend tool, one momentum tool, and volume, then stay consistent for several weeks. For most beginners, the best technical indicators for cryptocurrency trading 2026 are still the boring ones: volume, RSI, and one or two moving averages used consistently.
RSI Practical Settings
Standard setting: 14 periods. This is the default on TradingView and on Bitara's charting interface. It is the most widely used and therefore the most "self-fulfilling" — many participants are watching the same RSI levels.
More sensitive (shorter period, e.g. 9): RSI will cross overbought and oversold levels more frequently. More signals, but also more false signals. Suitable for shorter timeframe scalping only.
Less sensitive (longer period, e.g. 21): RSI moves more slowly and stays in each zone for longer. Fewer signals, but more reliable on higher timeframes.
Start with the standard 14 setting. Change it only when you have a specific, tested reason.
Part 2: MACD — Moving Average Convergence Divergence
What It Actually Measures
MACD compares two exponential moving averages — the 12-period EMA and the 26-period EMA — and plots their difference as the MACD line. A 9-period EMA of the MACD line itself becomes the signal line. The histogram shows the distance between the MACD line and the signal line.
In plain language: MACD tells you whether short-term momentum is stronger or weaker than medium-term momentum, and whether that relationship is accelerating or decelerating.
If RSI is often used to judge whether a move is getting stretched, MACD is usually more helpful for understanding how momentum is behaving inside a trend. The classic version uses the 12-period EMA and the 26-period EMA, with a 9-period EMA used as the signal line.
The Standard Signals
Bullish crossover: The MACD line crosses above the signal line. Short-term momentum is now stronger than medium-term momentum — buyers are accelerating relative to the recent trend. In an established uptrend, this is a buy signal confirmation.
Bearish crossover: The MACD line crosses below the signal line. Short-term momentum is weakening relative to medium-term — sellers are gaining ground. In an established downtrend, this confirms bearish momentum.
Above zero vs. below zero: The MACD line being above zero means the 12-period EMA is above the 26-period EMA — the shorter-term trend is bullish. Below zero means the opposite. Crossovers that occur above zero in an uptrend are stronger bullish signals than crossovers below zero.
Histogram expansion and contraction: When the histogram bars are growing, momentum is accelerating. When they are shrinking, momentum is decelerating. Histogram bars shrinking toward zero often precede a MACD crossover — giving you early warning that momentum is shifting.
The Misuse: Trading Every Crossover in Choppy Markets
MACD is better for trend confirmation, and RSI is better for timing entries and exits. Combining MACD and RSI is a popular approach — use RSI to identify overbought or oversold conditions and MACD to confirm the trend direction.
The MACD's fatal weakness is in sideways, choppy markets. When price oscillates without direction, MACD generates a constant stream of crossovers — short-term momentum flip-flopping between bullish and bearish with every price wave. Trading every crossover in these conditions produces a sequence of small losses that compounds into significant damage.
MACD tracks trends via moving average convergence divergence, ideal for medium-long term trading. Relying solely on moving average crossovers produces inconsistent win rates, particularly during sideways or low-volume trading periods.
The rule: only take MACD crossover signals in trending markets. Before acting on a crossover, ask: is the market in a clear trend or a range? If the latter, wait for trending conditions to return before using MACD signals.
MACD Divergence
Like RSI, MACD delivers its highest-quality signals through divergence.
Bearish MACD divergence: Price makes new highs but the MACD histogram peaks are getting smaller on each new price high. The trend is continuing but with decreasing momentum — a warning that the trend is aging.
Bullish MACD divergence: Price makes new lows but the MACD histogram troughs are becoming less negative on each new price low. Sellers are losing momentum even as price continues lower.
MACD divergence on the daily chart is one of the most reliable early-warning signals of a major trend reversal in Bitcoin and Ethereum. It does not give a precise entry — price can continue in the existing direction for some time after divergence appears — but it is a high-value signal that changes how you should size and manage existing positions.
Part 3: Moving Averages — The Trend Context Tool
What They Are
A moving average calculates the average closing price of an asset over a specified number of periods and plots it as a continuous line. As new data arrives, the oldest data point is dropped and the average updates.
Simple Moving Average (SMA): All periods given equal weight in the calculation.
Exponential Moving Average (EMA): More recent periods given higher weight. EMA responds faster to recent price changes than SMA.
For crypto trading, EMAs are more commonly used because of their responsiveness. For long-term trend assessment, SMAs — particularly the 200-day SMA — are the institutional standard.
The Key Levels and What They Mean
The 200-period Moving Average (daily chart): The single most watched moving average in all of finance. On the Bitcoin daily chart, the 200-day MA is the dividing line between macro bull and bear conditions. Price above the 200 MA means long-term trend is bullish. Price below means bearish.
In 2022, Bitcoin spent most of the year below its 200-day MA. In 2023 and 2024, it reclaimed and held above it. The move above the 200 MA in early 2023 was one of the earliest signals that the bear market was ending.
The 50-period Moving Average: A medium-term trend indicator. In healthy uptrends, price frequently bounces off the 50 MA on pullbacks — it acts as dynamic support. In downtrends, it frequently caps rallies — acting as dynamic resistance.
The 21-period EMA: A shorter-term trend indicator favoured by many swing traders. In strong uptrends, pullbacks to the 21 EMA often provide high-probability long entries.
The Golden Cross and Death Cross
A golden cross occurs when a short-term moving average — typically the 50-period — crosses above a longer-term moving average, such as the 200-period. This intersection visually signals that recent price momentum has strengthened beyond the longer-term trend, often triggering bullish entry opportunities.
The Death Cross is the inverse: the 50-period crosses below the 200-period, signalling that medium-term momentum has weakened below the long-term trend.
Important caveat: Both signals are lagging. By the time a Golden Cross forms, a significant portion of the upward move has already happened. They are confirmation signals — useful for high-conviction trend confirmation — not early entry signals.
In 2024, the Bitcoin Golden Cross formed in late January. Bitcoin had already moved substantially from its 2023 lows. Traders who waited for the Golden Cross to enter missed much of the move but still captured substantial gains in the subsequent months.
Price vs. Moving Average Relationship
The single most reliable use of moving averages is simply observing the relationship between current price and the MA level:
Price above MA: The trend bias is bullish for that timeframe. Trade longs with the trend.
Price below MA: The trend bias is bearish for that timeframe. Only take short positions or stand aside.
Price touching MA from above: Potential support — a bounce opportunity in an uptrend, with stop below the MA.
Price touching MA from below: Potential resistance — a rejection opportunity in a downtrend, with stop above the MA.
This simple framework — price above MA = bullish bias, below = bearish — filters out a large proportion of counter-trend trades that are the leading cause of preventable losses.
The Three-Indicator Framework: Putting It Together
Here is the optimal starting framework for a Bitara trader using these three indicators in combination:
Set up:
- 200-period SMA on the daily chart (trend context)
- 21-period EMA on the 4-hour chart (dynamic support/resistance)
- RSI (14 periods) on the 4-hour chart (momentum)
- MACD (12, 26, 9) on the 4-hour chart (momentum confirmation)
- Volume bars on both timeframes
The entry process:
Step 1: Daily chart — Is price above or below the 200 SMA? This defines your directional bias. Only take long trades when price is above. Only take shorts when price is below.
Step 2: 4-hour chart — Is price in a clear uptrend (HH/HL) or downtrend (LH/LL) matching the daily bias? If yes, proceed. If ranging, wait.
Step 3: Is price near the 21 EMA on the 4-hour chart? Entries near dynamic support (in uptrends) or dynamic resistance (in downtrends) have better risk-to-reward profiles than entries in the middle of a range.
Step 4: RSI confirmation — In an uptrend, is RSI above 50 (healthy momentum) without extreme divergence? In a downtrend, is RSI below 50?
Step 5: MACD confirmation — Has a bullish crossover occurred above zero (for longs) or a bearish crossover below zero (for shorts)?
Wait for MACD bullish crossover. Confirm RSI is rising but under 70. Ensure price is above the 50-day EMA for trend alignment. This combination helps filter out false signals and improves trade timing.
When all five conditions align, you have a high-quality setup. When one or two are missing, the setup is lower quality and should either be passed on or traded with reduced size.
Common Indicator Mistakes and How to Fix Them
Adding more indicators when losing. The instinct to add complexity when trades are failing is almost universal and almost always wrong. The answer to losing is not more indicators — it is better understanding of the indicators you already have, and better discipline in applying them.
Switching indicator settings constantly. Changing RSI from 14 to 9 because the 14 "missed" a signal is optimising backwards. You are fitting the indicator to past data. Stay with standard settings long enough to observe genuine performance across varied market conditions.
Using indicators as the first step. Indicators should come after price structure and support/resistance analysis — not before. Read charts in this order: Start with trend, then mark support and resistance, then check volume, then use one confirming indicator. Indicators that confirm price structure analysis are powerful. Indicators used instead of price structure analysis are noise.
Expecting indicators to work in all conditions. RSI divergence is powerful on trending daily charts. It is noise on choppy 15-minute charts. MACD crossovers work in trends. They are traps in ranges. Match your indicator to the market condition, not the other way around.
Ignoring the timeframe hierarchy. A bullish RSI reading on the 15-minute chart means nothing if the daily chart is in a confirmed downtrend. Always validate indicator signals on higher timeframes first.
The Minimum Viable Indicator Setup
If you could use only two indicators plus volume — which is genuinely sufficient for most profitable trading strategies — they should be:
RSI (14 periods) on the 4-hour chart. Use it for divergence detection and momentum context. Do not buy oversold signals or sell overbought signals mechanically.
200-period SMA on the daily chart. Use it for macro trend direction. Trade with it, not against it.
Volume. Use it to confirm or question every significant price move.
That is it. Three data points. Clean chart. Clear decisions.
Mark key support and resistance levels on the daily and 4-hour charts. Check RSI to see if the token is overbought or oversold. Look at volume to confirm whether recent moves are backed by real trading activity. Switch to lower timeframes only after confirming the setup on higher ones.
The most common mistake in technical analysis is not using too few tools. It is using too many.
Practice: 30 Days to Indicator Literacy
Week 1: Open TradingView. Add only the 200-day SMA to BTC daily. For 7 days, simply observe the relationship between price and that line. When does price treat it as support? When does it reject? Look at the past 3 years of data.
Week 2: Add RSI to the 4-hour chart. Spend 7 days finding every divergence instance in the past 12 months of BTC. Mark them with annotations. Note which resolved as reversals and which did not. You are building intuition, not a trading rule.
Week 3: Add MACD. Identify every bullish crossover above zero and bearish crossover below zero in the past 12 months. Note which occurred in trends versus ranges. Observe how the histogram behaved before each crossover.
Week 4: Combine all three. Identify 5 historical trades where all three confirmed the same direction simultaneously. Calculate the theoretical risk-to-reward if you had traded each.
After 30 days of this process, you will understand these three indicators more deeply than 90% of retail traders — without placing a single real trade. That foundation makes every subsequent trade more informed.
Disclaimer: This content is for educational purposes only and does not constitute financial advice. Technical indicators are tools for analysis, not guarantees of outcome. Always use risk management including stop-losses and position sizing appropriate to your financial situation.
Share This Post
By Bitara Academy · June 2026 · 13 min read
The Chart That Looks Like a Fighter Jet Cockpit
You added RSI. Then MACD. Maybe Bollinger Bands. A couple of moving averages. Perhaps Stochastic and Volume Profile. Before long, your chart is covered in coloured lines, histograms, and oscillators — and somehow, you are still losing money.
Meanwhile, the professional trader on the other side of your trade is looking at a clean chart with two or three tools, making high-probability decisions with clarity and speed.
This is the indicator paradox: more indicators feel like more information, but they actually produce more confusion, more contradictory signals, and worse outcomes. The traders who consistently profit from technical analysis are not the ones using the most sophisticated tools. They are the ones who deeply understand a small number of tools and use them correctly.
This guide covers the three most searched, most used, and most misused indicators in crypto — RSI, MACD, and Moving Averages — with the depth required to actually use them well. Not as fortune tellers. As decision frameworks.
The Fundamental Misconception About Indicators
Before covering each indicator individually, the single most important thing to understand:
Indicators do not predict the future. They describe the present.
RSI is not telling you the price will fall. It is telling you that recent upward momentum has been unusually strong relative to history. MACD is not telling you to buy. It is telling you that short-term momentum has shifted relative to longer-term momentum. A moving average is not a magic support level. It is the mathematical average of past prices — useful context, not prophecy.
The moment you stop expecting indicators to tell you what will happen, and start using them to understand what is happening, they become enormously more useful.
Indicators are not predictive magic tools. They are decision frameworks. Most traders fail because they expect indicators to tell them what will happen, instead of helping them understand what is happening. That distinction changes everything.
With that foundation established, here is how each indicator works and how to use it correctly.
Part 1: RSI — The Relative Strength Index
What It Actually Measures
RSI measures the speed and magnitude of recent price changes. Specifically, it calculates the ratio of average gains to average losses over a specified lookback period (standard is 14 periods) and normalises the result to a scale of 0 to 100.
A high RSI value means recent gains have been significantly larger than recent losses — the asset has been moving up strongly. A low RSI value means recent losses have significantly outpaced gains — the asset has been declining strongly.
RSI helps traders spot when a crypto asset is potentially overbought (too expensive) or oversold (undervalued). If Bitcoin's RSI hits 80, it might signal a short-term pullback.
The Standard — and Misused — Interpretation
Above 70 = overbought. Below 30 = oversold.
Most traders learn this and immediately start selling every time RSI crosses 70 and buying every time it crosses 30. This approach fails regularly and for a specific reason: in a strong trending market, RSI can stay in overbought territory for the entire duration of the trend.
During Bitcoin's rally from $30,000 to $69,000 in 2021, RSI was above 70 for extended periods. Every trader who sold when RSI crossed 70 left the majority of that move on the table. The "overbought" reading was technically accurate — momentum was strong — but it was not a sell signal in the context of that trend.
The correct reading of overbought and oversold:
In a ranging market: overbought and oversold readings are reliable mean-reversion signals. Price oscillates between levels without sustained directional bias. RSI above 70 suggests the current range high is near. RSI below 30 suggests the current range low is near.
In a trending market: overbought and oversold readings are trend strength signals, not reversal signals. In an uptrend, RSI staying above 50 — and periodically touching 70+ — is confirmation that the trend is healthy. It should not trigger selling.
Context is everything. The same RSI reading means different things in different market conditions.
The High-Value RSI Signal: Divergence
Divergence is where RSI delivers its most reliable and most actionable information.
Bearish divergence: Price makes a new higher high, but RSI makes a lower high on that same move. Price is reaching new highs, but the momentum behind those highs is weakening. This is a warning signal — not a guaranteed reversal, but evidence that the buyers driving the trend are losing conviction.
Bullish divergence: Price makes a new lower low, but RSI makes a higher low on that same move. Price is still falling, but the sellers driving it are losing momentum. This often precedes a trend reversal or at minimum a significant bounce.
Divergence signals are most reliable on the 4-hour and daily charts. On lower timeframes, the noise-to-signal ratio makes divergences less dependable.
Choose one trend tool, one momentum tool, and volume, then stay consistent for several weeks. For most beginners, the best technical indicators for cryptocurrency trading 2026 are still the boring ones: volume, RSI, and one or two moving averages used consistently.
RSI Practical Settings
Standard setting: 14 periods. This is the default on TradingView and on Bitara's charting interface. It is the most widely used and therefore the most "self-fulfilling" — many participants are watching the same RSI levels.
More sensitive (shorter period, e.g. 9): RSI will cross overbought and oversold levels more frequently. More signals, but also more false signals. Suitable for shorter timeframe scalping only.
Less sensitive (longer period, e.g. 21): RSI moves more slowly and stays in each zone for longer. Fewer signals, but more reliable on higher timeframes.
Start with the standard 14 setting. Change it only when you have a specific, tested reason.
Part 2: MACD — Moving Average Convergence Divergence
What It Actually Measures
MACD compares two exponential moving averages — the 12-period EMA and the 26-period EMA — and plots their difference as the MACD line. A 9-period EMA of the MACD line itself becomes the signal line. The histogram shows the distance between the MACD line and the signal line.
In plain language: MACD tells you whether short-term momentum is stronger or weaker than medium-term momentum, and whether that relationship is accelerating or decelerating.
If RSI is often used to judge whether a move is getting stretched, MACD is usually more helpful for understanding how momentum is behaving inside a trend. The classic version uses the 12-period EMA and the 26-period EMA, with a 9-period EMA used as the signal line.
The Standard Signals
Bullish crossover: The MACD line crosses above the signal line. Short-term momentum is now stronger than medium-term momentum — buyers are accelerating relative to the recent trend. In an established uptrend, this is a buy signal confirmation.
Bearish crossover: The MACD line crosses below the signal line. Short-term momentum is weakening relative to medium-term — sellers are gaining ground. In an established downtrend, this confirms bearish momentum.
Above zero vs. below zero: The MACD line being above zero means the 12-period EMA is above the 26-period EMA — the shorter-term trend is bullish. Below zero means the opposite. Crossovers that occur above zero in an uptrend are stronger bullish signals than crossovers below zero.
Histogram expansion and contraction: When the histogram bars are growing, momentum is accelerating. When they are shrinking, momentum is decelerating. Histogram bars shrinking toward zero often precede a MACD crossover — giving you early warning that momentum is shifting.
The Misuse: Trading Every Crossover in Choppy Markets
MACD is better for trend confirmation, and RSI is better for timing entries and exits. Combining MACD and RSI is a popular approach — use RSI to identify overbought or oversold conditions and MACD to confirm the trend direction.
The MACD's fatal weakness is in sideways, choppy markets. When price oscillates without direction, MACD generates a constant stream of crossovers — short-term momentum flip-flopping between bullish and bearish with every price wave. Trading every crossover in these conditions produces a sequence of small losses that compounds into significant damage.
MACD tracks trends via moving average convergence divergence, ideal for medium-long term trading. Relying solely on moving average crossovers produces inconsistent win rates, particularly during sideways or low-volume trading periods.
The rule: only take MACD crossover signals in trending markets. Before acting on a crossover, ask: is the market in a clear trend or a range? If the latter, wait for trending conditions to return before using MACD signals.
MACD Divergence
Like RSI, MACD delivers its highest-quality signals through divergence.
Bearish MACD divergence: Price makes new highs but the MACD histogram peaks are getting smaller on each new price high. The trend is continuing but with decreasing momentum — a warning that the trend is aging.
Bullish MACD divergence: Price makes new lows but the MACD histogram troughs are becoming less negative on each new price low. Sellers are losing momentum even as price continues lower.
MACD divergence on the daily chart is one of the most reliable early-warning signals of a major trend reversal in Bitcoin and Ethereum. It does not give a precise entry — price can continue in the existing direction for some time after divergence appears — but it is a high-value signal that changes how you should size and manage existing positions.
Part 3: Moving Averages — The Trend Context Tool
What They Are
A moving average calculates the average closing price of an asset over a specified number of periods and plots it as a continuous line. As new data arrives, the oldest data point is dropped and the average updates.
Simple Moving Average (SMA): All periods given equal weight in the calculation.
Exponential Moving Average (EMA): More recent periods given higher weight. EMA responds faster to recent price changes than SMA.
For crypto trading, EMAs are more commonly used because of their responsiveness. For long-term trend assessment, SMAs — particularly the 200-day SMA — are the institutional standard.
The Key Levels and What They Mean
The 200-period Moving Average (daily chart): The single most watched moving average in all of finance. On the Bitcoin daily chart, the 200-day MA is the dividing line between macro bull and bear conditions. Price above the 200 MA means long-term trend is bullish. Price below means bearish.
In 2022, Bitcoin spent most of the year below its 200-day MA. In 2023 and 2024, it reclaimed and held above it. The move above the 200 MA in early 2023 was one of the earliest signals that the bear market was ending.
The 50-period Moving Average: A medium-term trend indicator. In healthy uptrends, price frequently bounces off the 50 MA on pullbacks — it acts as dynamic support. In downtrends, it frequently caps rallies — acting as dynamic resistance.
The 21-period EMA: A shorter-term trend indicator favoured by many swing traders. In strong uptrends, pullbacks to the 21 EMA often provide high-probability long entries.
The Golden Cross and Death Cross
A golden cross occurs when a short-term moving average — typically the 50-period — crosses above a longer-term moving average, such as the 200-period. This intersection visually signals that recent price momentum has strengthened beyond the longer-term trend, often triggering bullish entry opportunities.
The Death Cross is the inverse: the 50-period crosses below the 200-period, signalling that medium-term momentum has weakened below the long-term trend.
Important caveat: Both signals are lagging. By the time a Golden Cross forms, a significant portion of the upward move has already happened. They are confirmation signals — useful for high-conviction trend confirmation — not early entry signals.
In 2024, the Bitcoin Golden Cross formed in late January. Bitcoin had already moved substantially from its 2023 lows. Traders who waited for the Golden Cross to enter missed much of the move but still captured substantial gains in the subsequent months.
Price vs. Moving Average Relationship
The single most reliable use of moving averages is simply observing the relationship between current price and the MA level:
Price above MA: The trend bias is bullish for that timeframe. Trade longs with the trend.
Price below MA: The trend bias is bearish for that timeframe. Only take short positions or stand aside.
Price touching MA from above: Potential support — a bounce opportunity in an uptrend, with stop below the MA.
Price touching MA from below: Potential resistance — a rejection opportunity in a downtrend, with stop above the MA.
This simple framework — price above MA = bullish bias, below = bearish — filters out a large proportion of counter-trend trades that are the leading cause of preventable losses.
The Three-Indicator Framework: Putting It Together
Here is the optimal starting framework for a Bitara trader using these three indicators in combination:
Set up:
- 200-period SMA on the daily chart (trend context)
- 21-period EMA on the 4-hour chart (dynamic support/resistance)
- RSI (14 periods) on the 4-hour chart (momentum)
- MACD (12, 26, 9) on the 4-hour chart (momentum confirmation)
- Volume bars on both timeframes
The entry process:
Step 1: Daily chart — Is price above or below the 200 SMA? This defines your directional bias. Only take long trades when price is above. Only take shorts when price is below.
Step 2: 4-hour chart — Is price in a clear uptrend (HH/HL) or downtrend (LH/LL) matching the daily bias? If yes, proceed. If ranging, wait.
Step 3: Is price near the 21 EMA on the 4-hour chart? Entries near dynamic support (in uptrends) or dynamic resistance (in downtrends) have better risk-to-reward profiles than entries in the middle of a range.
Step 4: RSI confirmation — In an uptrend, is RSI above 50 (healthy momentum) without extreme divergence? In a downtrend, is RSI below 50?
Step 5: MACD confirmation — Has a bullish crossover occurred above zero (for longs) or a bearish crossover below zero (for shorts)?
Wait for MACD bullish crossover. Confirm RSI is rising but under 70. Ensure price is above the 50-day EMA for trend alignment. This combination helps filter out false signals and improves trade timing.
When all five conditions align, you have a high-quality setup. When one or two are missing, the setup is lower quality and should either be passed on or traded with reduced size.
Common Indicator Mistakes and How to Fix Them
Adding more indicators when losing. The instinct to add complexity when trades are failing is almost universal and almost always wrong. The answer to losing is not more indicators — it is better understanding of the indicators you already have, and better discipline in applying them.
Switching indicator settings constantly. Changing RSI from 14 to 9 because the 14 "missed" a signal is optimising backwards. You are fitting the indicator to past data. Stay with standard settings long enough to observe genuine performance across varied market conditions.
Using indicators as the first step. Indicators should come after price structure and support/resistance analysis — not before. Read charts in this order: Start with trend, then mark support and resistance, then check volume, then use one confirming indicator. Indicators that confirm price structure analysis are powerful. Indicators used instead of price structure analysis are noise.
Expecting indicators to work in all conditions. RSI divergence is powerful on trending daily charts. It is noise on choppy 15-minute charts. MACD crossovers work in trends. They are traps in ranges. Match your indicator to the market condition, not the other way around.
Ignoring the timeframe hierarchy. A bullish RSI reading on the 15-minute chart means nothing if the daily chart is in a confirmed downtrend. Always validate indicator signals on higher timeframes first.
The Minimum Viable Indicator Setup
If you could use only two indicators plus volume — which is genuinely sufficient for most profitable trading strategies — they should be:
RSI (14 periods) on the 4-hour chart. Use it for divergence detection and momentum context. Do not buy oversold signals or sell overbought signals mechanically.
200-period SMA on the daily chart. Use it for macro trend direction. Trade with it, not against it.
Volume. Use it to confirm or question every significant price move.
That is it. Three data points. Clean chart. Clear decisions.
Mark key support and resistance levels on the daily and 4-hour charts. Check RSI to see if the token is overbought or oversold. Look at volume to confirm whether recent moves are backed by real trading activity. Switch to lower timeframes only after confirming the setup on higher ones.
The most common mistake in technical analysis is not using too few tools. It is using too many.
Practice: 30 Days to Indicator Literacy
Week 1: Open TradingView. Add only the 200-day SMA to BTC daily. For 7 days, simply observe the relationship between price and that line. When does price treat it as support? When does it reject? Look at the past 3 years of data.
Week 2: Add RSI to the 4-hour chart. Spend 7 days finding every divergence instance in the past 12 months of BTC. Mark them with annotations. Note which resolved as reversals and which did not. You are building intuition, not a trading rule.
Week 3: Add MACD. Identify every bullish crossover above zero and bearish crossover below zero in the past 12 months. Note which occurred in trends versus ranges. Observe how the histogram behaved before each crossover.
Week 4: Combine all three. Identify 5 historical trades where all three confirmed the same direction simultaneously. Calculate the theoretical risk-to-reward if you had traded each.
After 30 days of this process, you will understand these three indicators more deeply than 90% of retail traders — without placing a single real trade. That foundation makes every subsequent trade more informed.
Disclaimer: This content is for educational purposes only and does not constitute financial advice. Technical indicators are tools for analysis, not guarantees of outcome. Always use risk management including stop-losses and position sizing appropriate to your financial situation.